Effective n8n debugging is the critical skill that separates a novice automator from a seasoned pro. It involves systematically identifying and resolving errors within your workflows, whether it’s inspecting a node’s output data, analyzing failed production runs, or diving into backend logs. Mastering techniques like visual debugging on the canvas, leveraging the Executions list to re-run with failed data, and configuring log levels for self-hosted instances will transform how you build and maintain robust automations.
So, you’ve built a workflow. It looks perfect on the canvas, a beautiful chain of interconnected nodes ready to save you hours of manual work. You hit ‘Execute Workflow’, lean back, and… nothing. Or worse, a dreaded red error message appears. We’ve all been there. That feeling of ‘what on earth just happened?’ is a rite of passage for every n8n user. But don’t worry, debugging in n8n isn’t a dark art; it’s a methodical process. Let’s walk through it together, from the simple checks to the pro-level deep dives.
The Foundation: Visual Debugging on the Canvas
Let’s be honest, the first line of defense is always the most direct one. Visual debugging is your bread and butter, the process of running nodes and immediately inspecting what comes out.
Step-by-Step Inspection
Your first instinct shouldn’t be to run the entire workflow. Instead, execute your nodes one by one, starting from the trigger. After each execution, click on the node and check the output panel. Does the data look like you expect it to?
Think of it like checking a string of Christmas lights. You don’t just stare at the whole dark string; you check each bulb individually until you find the one that’s out. Is the data structure correct? Are the field names what you thought they were? This simple process solves a surprisingly large number of issues.
Understanding the Output Views
n8n gives you three powerful ways to view a node’s output data:
- Table View: Perfect for a quick, human-readable scan. It’s great for verifying that you have the right number of items and that key fields are populated.
- JSON View: This is where the real truth lies. It shows you the exact data structure, including nested objects and arrays. I spend 90% of my debugging time here, confirming the precise path to the data I need for my expressions.
- Schema View: An often-overlooked hero, the Schema view tells you the data type of each field (string, number, boolean, etc.). This is crucial when a node is expecting a number but you’re accidentally feeding it a string like “123”.
A handy trick I use constantly is dropping a No Operation, do nothing node (or ‘No-Op’ node) into my workflow. It acts like a temporary breakpoint. I can pipe data into it from anywhere, execute up to that point, and peacefully inspect the data without worrying about the rest of the workflow firing.
Level Up: Using Execution Logs for Post-Mortem Analysis
What happens when a workflow fails silently in the background at 3 AM? You can’t visually debug it live. This is where the Executions list becomes your time machine.
Every time your active workflow runs, it creates an entry in the Executions list. Here, you can see if it succeeded or failed. If it failed, n8n offers a magical button: Debug in editor.
Clicking this loads the exact data from that failed run directly into your workflow canvas, pinning it to the trigger node. Now you can see precisely what information caused the failure and step through the workflow with the problematic data to find the weak link.
Real-World Example: The Case of the Missing Address
Imagine a workflow that triggers on new Shopify orders, looks up the customer in a CRM, and then sends the shipping address to a logistics API. It’s been working perfectly for weeks, but this morning you see a failed execution from overnight.
- Find the Failure: You navigate to the Executions tab and find the red ‘failed’ entry.
- Load the Data: You click ‘Debug in editor’. The trigger node now contains the exact Shopify order that caused the problem.
- Investigate: You execute the workflow node by node. The Shopify node has data, the CRM lookup works, but the ‘HTTP Request’ node to the logistics API fails with a “Cannot read properties of undefined” error.
- Pinpoint the Cause: You examine the output of the CRM node and realize this particular customer was a guest checkout and has no address stored in the CRM. The workflow was trying to reference a field (
customer.address.street) that didn’t exist. - Implement the Fix: The solution is simple! You add an IF node right after the CRM lookup to check if the address field exists. If it does, the workflow proceeds to the logistics API. If not, it could send a notification to a manager or simply stop, preventing the error.
By using the debug feature, you turned a mysterious failure into an actionable fix in minutes.
For the Self-Hosters: Advanced n8n Debugging with Logs
Sometimes, the problem isn’t with the data flow but with the n8n instance itself. This is particularly relevant for self-hosted users. You might be dealing with credential encryption issues, Docker networking problems, or complex errors inside a Code node. For these, you need to look under the hood at the backend logs.
By configuring environment variables, you can control the verbosity and destination of your n8n logs. This is your ultimate tool for complex n8n debugging.
Key Logging Configurations
| Variable | Example Value | Purpose | Pro Tip |
|---|---|---|---|
N8N_LOG_LEVEL |
debug |
Sets the detail level of the logs. | Use debug for troubleshooting, but switch back to info or warn in production to save disk space. |
N8N_LOG_OUTPUT |
console,file |
Defines where logs are sent. | console is great for docker logs, while file creates a persistent log file. |
N8N_LOG_FILE_LOCATION |
/home/n8n/.n8n/logs/n8n.log |
Specifies the log file path. | Ensure the n8n user has write permissions to this directory. |
Setting the log level to debug can feel like drinking from a firehose, but it provides an incredible amount of information, including detailed API request/response cycles and internal state messages that you simply can’t see on the canvas.
Final Pro-Tips
- Use the Browser Console: Inside a Code node, you can still use
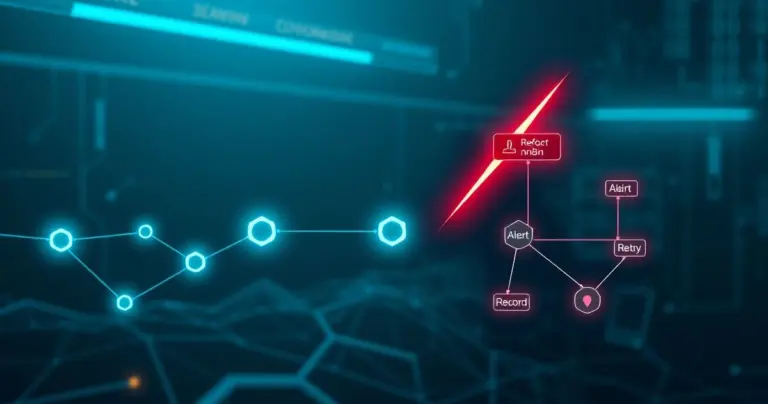
console.log('My data:', myVariable);. The output will appear in your web browser’s developer console (F12), which is fantastic for quick-and-dirty checks of your JavaScript logic. - Embrace Error Handling Nodes: Don’t just react to errors; plan for them. Use the Error Trigger node to build dedicated workflows that run only when another workflow fails. This allows you to build sophisticated alerting systems (e.g., post a message to a Slack channel with the error details).
Mastering n8n debugging is a journey. It starts with looking at the output and grows into a deep understanding of data flow and system architecture. By using these techniques, you’ll spend less time fixing and more time building amazing automations.